
What a Healthy Oxygen-Sensor Graph Should Look Like at Warm Idle
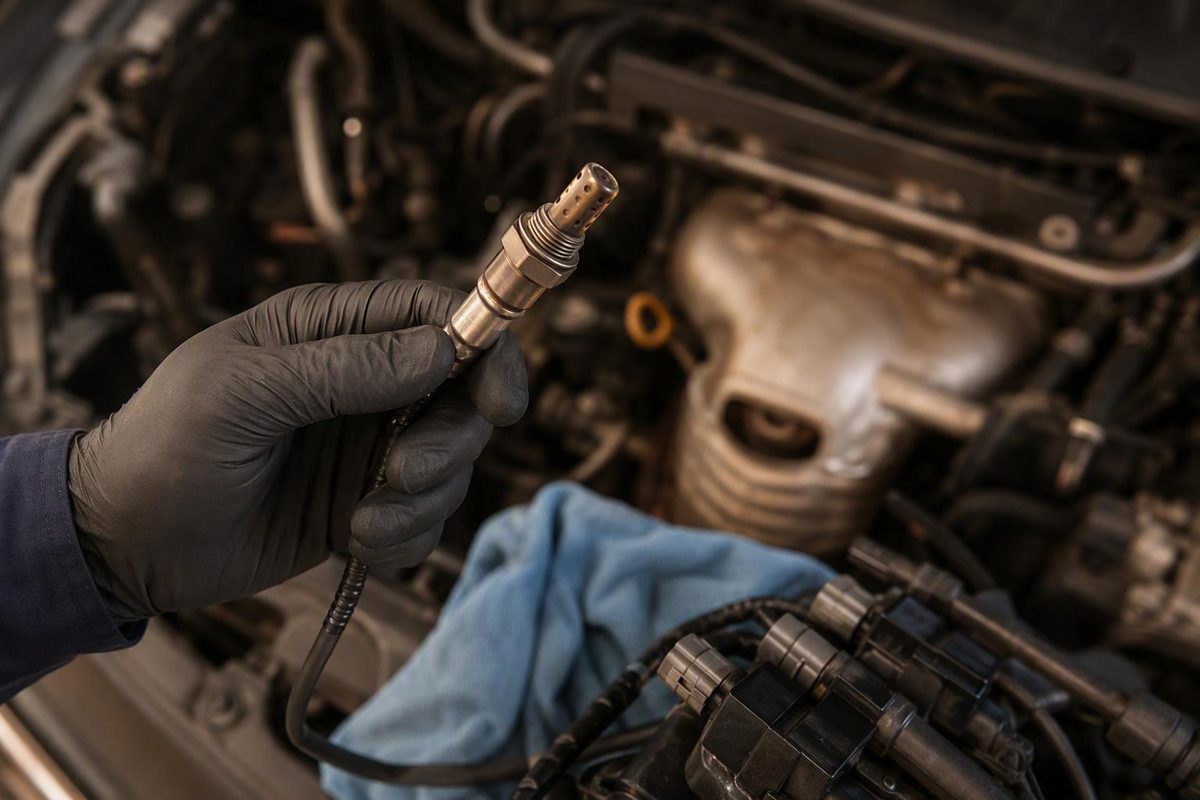
At warm closed-loop idle, a conventional narrowband upstream sensor should switch through about 0.1–0.9 V and cross roughly 0.45 V.
A fully warmed conventional upstream narrowband zirconia O2 sensor in closed loop should switch repeatedly through approximately 0.1–0.9 volts at idle, crossing roughly 0.45 V as fuel control moves between lean and rich. It should not remain at one fixed voltage. The downstream sensor should generally produce a steadier trace than the upstream sensor. Innova’s live-data guide gives the 0.1–0.9 V upstream range and describes a comparatively steady downstream signal.
These are general diagnostic patterns, not universal pass/fail specifications. Wideband air-fuel-ratio sensors and other sensor designs may report entirely different parameters. An abnormal graph is a direction for testing—not proof that the sensor has failed.
The normal warm-idle readings at a glance
There is no single normal O2-sensor voltage at idle. For a conventional upstream narrowband sensor, switching is the normal result. The signal repeatedly moves from lean to rich instead of settling at one value.
Published descriptions differ slightly. General ranges include approximately 0.1–0.9 V, 0.1–0.8 V, and 0.2–0.8 V, depending on the source and test conditions. CarParts.com describes a warmed traditional zirconia sensor in closed loop as moving from below 0.3 V to above 0.8 V. Treat all these endpoints as screening guidance rather than universal limits. CarParts.com explains the conventional zirconia switching pattern and its application limits.
| Sensor or condition | Expected warm-idle pattern | Interpretation |
|---|---|---|
| Upstream conventional narrowband, Sensor 1 | Repeated switching through roughly 0.1–0.9 V and across about 0.45 V | Normal closed-loop fuel-control activity |
| Downstream conventional narrowband, Sensor 2 | Comparatively steady; some general guides cite roughly 0.6–0.8 V | Often consistent with normal catalyst operation, but pattern and vehicle specifications matter more than one voltage |
| Wideband or air-fuel-ratio sensor | May report lambda, equivalence ratio, pump current, or a differently scaled voltage | Do not apply the conventional narrowband voltage rule |
Sensor 1 is upstream of the catalytic converter. Its signal provides feedback for fuel-mixture control. Sensor 2 is downstream of the converter and primarily monitors catalyst performance. On an engine with two banks, each bank may have its own Sensor 1 and Sensor 2.
Do not judge a downstream sensor by one snapshot. A reading such as 0.65 V can fall within a commonly published range, but it does not prove that the sensor or catalytic converter is healthy. The more useful general observation is that a conventional downstream trace should normally be steadier than the corresponding upstream trace.
Check these conditions before judging the graph
Do not diagnose an O2 sensor from the first voltage displayed after startup. Confirm the test conditions first:
- The engine and sensor are fully warm. Cold data can be misleading because a conventional zirconia sensor must reach operating temperature before producing its normal signal.
- The fuel system is in closed loop. In open loop, the control module is not using upstream feedback in the normal rich-lean correction cycle.
- You selected the correct bank and position. Verify Bank 1 or Bank 2 and Sensor 1 or Sensor 2.
- You know the sensor technology. Identify whether it is conventional narrowband zirconia, wideband air-fuel-ratio, titanium dioxide, or another design.
- You know what the scan parameter represents. A PID labeled “O2 voltage” is not necessarily a directly comparable signal on every vehicle.
Wideband sensors cannot be judged by looking for a conventional 0.1–0.9 V swing. Depending on the vehicle and scan tool, useful wideband data may appear as lambda, equivalence ratio, pump current, or a manufacturer-scaled voltage.
Titanium-dioxide sensors may also use substantially different circuits and ranges. Published technical guidance lists possible Titania ranges of 0–5 V, 0–3 V, or 0–1 V, illustrating why identifying the sensor design comes before interpreting the graph. Autotechnician explains the different ranges used by titanium-dioxide systems.
Verify the vehicle’s year, make, model, engine, bank, sensor position, and exact PID against manufacturer service information. Cold start, open-loop operation, deceleration fuel cut, and heavy load can produce patterns that differ from a stable warm-idle trace.
A practical warm-idle live-data check
Use a graph rather than a single numerical snapshot:
- Warm the engine fully.
- Confirm closed-loop operation on the scan tool.
- Select the correct upstream and downstream PIDs from the same bank.
- Graph both signals simultaneously if the tool permits.
- Capture a stable period of warm-idle operation.
- Review the voltage span, switching pattern, and relationship between the sensors.
A commercial live-data guide recommends observing at least 60 seconds of warm-idle upstream data rather than relying on a momentary reading. Treat that duration as a practical screening recommendation, not a manufacturer specification. Innova provides the 60-second observation recommendation.
Evaluate three separate qualities on a conventional upstream narrowband trace:
- Voltage span: Does the signal move toward both the lean and rich ends of its expected range?
- Threshold crossings: Does it repeatedly cross approximately 0.45 V instead of remaining on one side?
- Downstream comparison: Is Sensor 2 comparatively stable rather than copying each Sensor 1 switch?
General references describe approximately one low-to-high-and-back cycle per second at idle for the conventional pre-catalyst sensor being discussed. Another guide uses at least eight 0.45 V crossings in 10 seconds as a screening benchmark. Neither figure is a universal pass/fail specification. The once-per-second description comes from this conventional O2-sensor explanation.
Do not turn an above-idle test into an idle requirement. For example, CarParts.com describes a different switching check at approximately 1,200 rpm. Test speed and procedure matter, so use the manufacturer’s criteria when they differ from generic guidance.
Scanner speed also affects the displayed graph. A slow OBD-II adapter or low refresh rate can miss peaks, valleys, and threshold crossings, making a healthy sensor appear to have a narrower range or slower response. As practical checks, try displaying fewer PIDs or recording in the tool’s fastest available mode. If the trace still appears questionable, verify it with suitable test equipment rather than condemning the sensor from an undersampled graph.
What stuck-high, stuck-low, and fixed-midpoint readings mean
A stuck or slow reading identifies a diagnostic direction. High, low, midpoint, or slow readings do not independently prove that the O2 sensor needs replacement.
| Conventional-sensor pattern | Immediate meaning | Checks before replacing anything |
|---|---|---|
| Sustained near or above 0.8 V | Sensor reports rich exhaust, or circuit is biased high | Fuel trims, fuel pressure, injectors, contamination, signal wiring, grounds |
| Sustained near or below 0.2 V | Sensor reports lean exhaust, or circuit is biased low | Unmetered air, fuel delivery, exhaust leaks, misfires, wiring, grounds |
| Fixed near 0.45 V | Signal may be inactive, substituted, or nonresponsive | Closed-loop status, PID validity, wiring, connectors, fuses, grounds, heater |
| Slow or incomplete switching | Mixture may not be changing normally, sensor response may be slow, or graph may be undersampled | Scan rate, fuel trims, codes, mixture faults, heater operation, response tests |
| Downstream closely mirrors upstream | Catalyst oxygen-storage performance may be reduced | Catalyst codes and specified tests; mixture, exhaust, sensor, and circuit faults |
For conventional switching sensors, technical guidance commonly associates approximately 0.8 V with rich exhaust, 0.2 V with lean exhaust, and a steady value near 0.45 V with a potentially nonresponsive signal. These values describe what the sensor or circuit appears to report, not which part has failed. Autotechnician discusses conventional rich, lean, and switching voltage behavior.
A high trace may mean the engine is actually running rich. Check fuel trims, fuel pressure, injector operation, and possible sensor contamination or circuit bias before blaming the sensing element.
A low trace may mean the sensor is correctly reporting unmetered air, insufficient fuel delivery, an exhaust leak that introduces oxygen, or a misfire that leaves oxygen in the exhaust. Wiring and ground faults can also pull the signal low.
A fixed midpoint needs context. Confirm that the engine is in closed loop and that the selected PID is valid for that application. Then inspect the applicable heater circuit, power supply, fuses, connectors, signal wiring, and grounds.
Slow movement also needs context. Community waveform discussions illustrate how OBD-II interface and logging speed can materially alter the displayed trace, but such examples are not manufacturer specifications. A scan graph alone cannot conclusively identify a “lazy” sensor. This waveform discussion illustrates the effect of OBD-II update rate.
Compare both sensors before buying an O2 sensor or catalytic converter
Compare the upstream and downstream traces from the same bank. The conventional upstream sensor should switch as the control module adjusts fueling. The downstream sensor should generally remain steadier because it monitors exhaust after the catalytic converter.
If the downstream trace repeatedly rises and falls in close step with the upstream trace, reduced catalyst oxygen-storage performance is one possible explanation. It does not conclusively prove converter failure. Sensor faults, wiring problems, exhaust leaks, persistent mixture faults, and unsuitable test conditions can also affect the comparison.
Review the complete diagnostic picture:
- Stored, pending, and permanent trouble codes
- Freeze-frame conditions
- Short-term and long-term fuel trims
- Misfire data
- Fuel pressure and delivery
- MAF or other air-metering data
- O2-sensor heater codes and status
- Relevant catalyst-monitor results
Depending on the pattern, investigate vacuum leaks, exhaust leaks, ignition misfires, incorrect fuel pressure, restricted fuel delivery, leaking injectors, MAF faults, contamination, heater faults, damaged wiring, poor connector contact, and weak grounds. Engine, intake, fuel, ignition, exhaust, heater, or circuit faults can create abnormal O2 readings even when the sensing element is reporting correctly.
When vehicle service information calls for a response test, confirm that the conventional sensor responds in both rich and lean directions using the manufacturer’s approved procedure. Do not assume that piercing wires, introducing fuel, or deliberately creating a vacuum leak is suitable for every vehicle.
The final rule is simple: confirm which system failed before purchasing an oxygen sensor or catalytic converter. Normal depends first on sensor type and position. Use the graph together with operating status, fuel trims, trouble codes, circuit checks, and vehicle-specific test criteria.
Why does my scan tool show a narrower or slower O2-sensor waveform than expected?
The scanner may be undersampling the signal. A conventional upstream sensor can change faster than a basic OBD-II adapter refreshes its display, so the tool may miss peaks, valleys, and midpoint crossings.
As practical troubleshooting steps, display fewer PIDs, select the fastest available logging mode, and record the data rather than watching only a live numerical value. Also verify that the engine is warm, the system is in closed loop, and the selected PID represents a conventional narrowband sensor.
If the trace remains questionable, compare it with manufacturer criteria and use test equipment with sufficient resolution before condemning the sensor.
Should vehicle-specific service information override the general 0.1–0.9 V range?
Yes. The 0.1–0.9 V range is a general description for a fully warmed conventional narrowband zirconia upstream sensor operating in closed loop, not a specification for every O2 sensor.
Vehicle-specific service information takes priority because sensor technology, PID scaling, expected voltage, switching rate, test speed, and diagnostic procedure can differ. Use the generic range to recognize the basic switching pattern—not as a universal pass/fail limit.